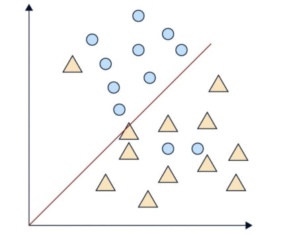
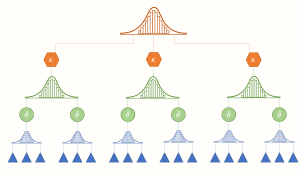
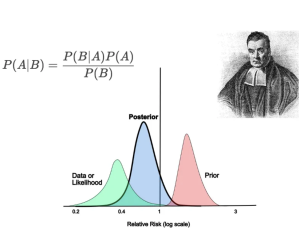
R projects Below you will find the R codes and annotations for various statistical analysis methods and techniques. R BASICS This document provides an overview of fundamental concepts in R, covering key topics such as basic operations, how to load packages, import data, examine datasets, and subset or export results. DATA PROECESSING This document introduces essential data processing techniques in R using the tidyverse package, including reading, transforming, and organizing datasets efficiently. DATA VISUALIZATION This document provides an overview of data visualization using ggplot2, a powerful and flexible plotting package in R. It covers the fundamentals of creating various types of graphs, customizing aesthetics, and enhancing visual clarity. DESCRIPTIVE STATISTICS This document introduces key descriptive statistics for summarizing data, including measures of frequency, central tendency, and dispersion. It helps you interpret and present numerical summaries effectively in R. T-TEST This document covers various t-tests used for comparing means, including single-sample, independent samples, Welch’s, and dependent samples t-tests. It also introduces nonparametric alternatives for cases where assumptions are not met. ONE-WAY ANOVA This document introduces One-Way ANOVA, a statistical method for comparing means across multiple groups. It covers assumptions, implementation in R, and interpretation of results, helping you determine whether group differences are statistically meaningful. FACTORIAL ANOVA This document explores Factorial ANOVA, a statistical method for analyzing interactions between multiple independent variables. It covers effect sizes, post-hoc tests, assumptions like homogeneity of variance, and real-world examples to help interpret and apply Factorial ANOVA in R. CORRELATION This document covers correlation analysis, including Pearson, Spearman, and Kendall’s Tau. It explores covariance, correlation matrices, and visualizations while addressing assumption checks. This guide helps you understand relationships between variables and interpret correlation results effectively in R. LINEAR REGRESSION This document introduces linear regression, covering unstandardized and standardized models. It explores key assumptions, model interpretation, and practical applications, providing a foundation for analyzing relationships between variables in R. MULTIPLE REGRESSION - PART 1 This document explores multiple regression, including model interpretation, standardization, and comparison. It covers key topics such as handling categorical predictors, detecting multicollinearity, and working with dummy variables to enhance model accuracy and reliability. MULTIPLE REGRESSION - PART 2 This document continues the exploration of multiple regression, focusing on advanced topics such as interaction effects, model diagnostics, assumption checks, and improving model performance. It provides practical guidance for refining regression models and ensuring accurate interpretations. REPEATED MEASURES ANOVA This document covers Repeated Measures ANOVA, demonstrating its implementation using aov and ezANOVA. It explores within-subject factors, adding between-subject variables, and using cluster-robust standard errors to account for data dependencies, ensuring accurate statistical analysis in R. CHI-SQUARE TEST This document introduces the Chi-Square Test, covering the Goodness of Fit test for comparing observed and expected frequencies and the Test of Independence for assessing relationships between categorical variables. It provides step-by-step implementation and interpretation. ANCOVA This document introduces Analysis of Covariance (ANCOVA), a statistical method that combines ANOVA and regression to compare group means while controlling for covariates. It covers model assumptions, implementation in R, and interpretation of results to enhance data analysis accuracy. MANOVA This document introduces Multivariate Analysis of Variance (MANOVA), a statistical method for comparing multiple dependent variables across groups. It covers key assumptions, including homogeneity of variances and covariance matrices, effect size calculation, and post-hoc tests to interpret group differences accurately. REPEATED MEASURES MANOVA This document covers Profile Analysis, a form of Repeated Measures MANOVA used for comparing multivariate repeated measures data. It explores key components such as data visualization, parallelism, coincidental profiles, and tests for flatness, providing a structured approach to analyzing profile data. DISCRIMINANT ANALYSIS This document introduces Discriminant Analysis, a classification technique for distinguishing between groups based on predictor variables. It covers Linear (LDA), Quadratic (QDA), Mixture (MDA), Flexible (FDA), and Regularized (RDA) Discriminant Analysis. LOGISTIC REGRESSION This document introduces Logistic Regression, a statistical method for modeling binary outcomes. It covers data exploration, key assumptions, model implementation, and using logistic regression for prediction, providing a structured approach to classification analysis. PRINCIPAL COMPONENT ANALYSIS This document introduces Principal Component Analysis (PCA), a dimensionality reduction technique for exploring patterns in high-dimensional data. It includes step-by-step examples demonstrating how to apply PCA in R, interpret results, and visualize principal components effectively. EXPLORATORY FACTOR ANALYSIS This document introduces Exploratory Factor Analysis (EFA), a technique for identifying underlying latent factors in datasets. It covers data exploration, factor extraction, oblique rotation, and comparing different factor solutions to enhance interpretability. MULTI-LEVEL MODELING This document introduces Multilevel Modeling (MLM) for analyzing hierarchical data structures. It covers exploratory analysis, model building, intraclass correlation (ICC), and troubleshooting convergence issues while optimizing random effects structures in R. MISSING VALUES This document explores techniques for handling missing data, including classification, pattern visualization using the mice package, and various imputation methods. It covers distribution comparisons between original and imputed data and introduces the missForest package for robust imputation. BAYESIAN ANALYSIS This document introduces Bayesian Inference, explaining its principles, advantages, and applications in data analysis. It covers Bayes' Theorem, how Bayesian methods work, and why they are useful for statistical modeling, providing a foundation for Bayesian data analysis in R. RELIABILITY MEASURES This document provides data and examples for computing reliability measures. It focuses on inter-rater reliability (Cohen’s and Fleiss's Kappa, ICC) and test reliability (Cronbach’s Alpha, McDonald’s Omega), with accompanying R code for all computations.